Industries Consumer goods
Consumer goodsFind the cause, not just the complaint.
We connect complaints, testing, production and supply chain data so quality problems surface early and trace back to the batch, the line and the supplier.
Where the data lives.
Consumer goods makers run high volumes across many sites and suppliers. When something goes wrong, the evidence is spread across systems and written in customers' own words.
Who we work with Quality, supply chain, operations and finance teams.
Where data gets in the way.
Complaints arrive as free text.
Thousands a month, in customers' own words, across every channel.
Quality sits apart from production.
Testing, batch and complaint data rarely meet.
Several ERPs, several truths.
Acquisitions and regions leave systems that disagree.
Supply chains are hard to see.
Stock, supply and delivery tracked in different places.
What we build.
Complaints traced to causes
Every complaint read, grouped by cause and traced to batch, line and supplier.
document AI · analytics
One ERP, one truth
Consolidation and migration with reporting rebuilt on a single model.
migration · data platform
Supply chain analytics
Supply, stock and delivery performance end to end.
analytics · dashboards
From thousands of complaints to one cause, in 90 seconds.
Complaints arrive in customers' own words, with photos. Watch the system read the batch code, group the complaints, trace the rise to one line and one supplier lot, and draft the quality alert.
A contained demo on invented data. Nothing you do here leaves the page.
Where the same data goes next.
- Demand planning and forecasting by product, channel and region.
- Supplier scorecards from quality, delivery and complaint data.
- Sentiment tracked by product and region over time.
What our team has done before.
Work our team has delivered across their careers. Clients are anonymised.
Quality dashboards linking product testing, claims and complaints for a global consumer goods manufacturer.
ERP consolidation and migration, with reporting rebuilt on a single model.
Start with last quarter's complaints. We group them by cause and show which batches and lines they lead back to.
Tell us the report your team rebuilds every month.
No pitch. We will show you what your own records could already do.
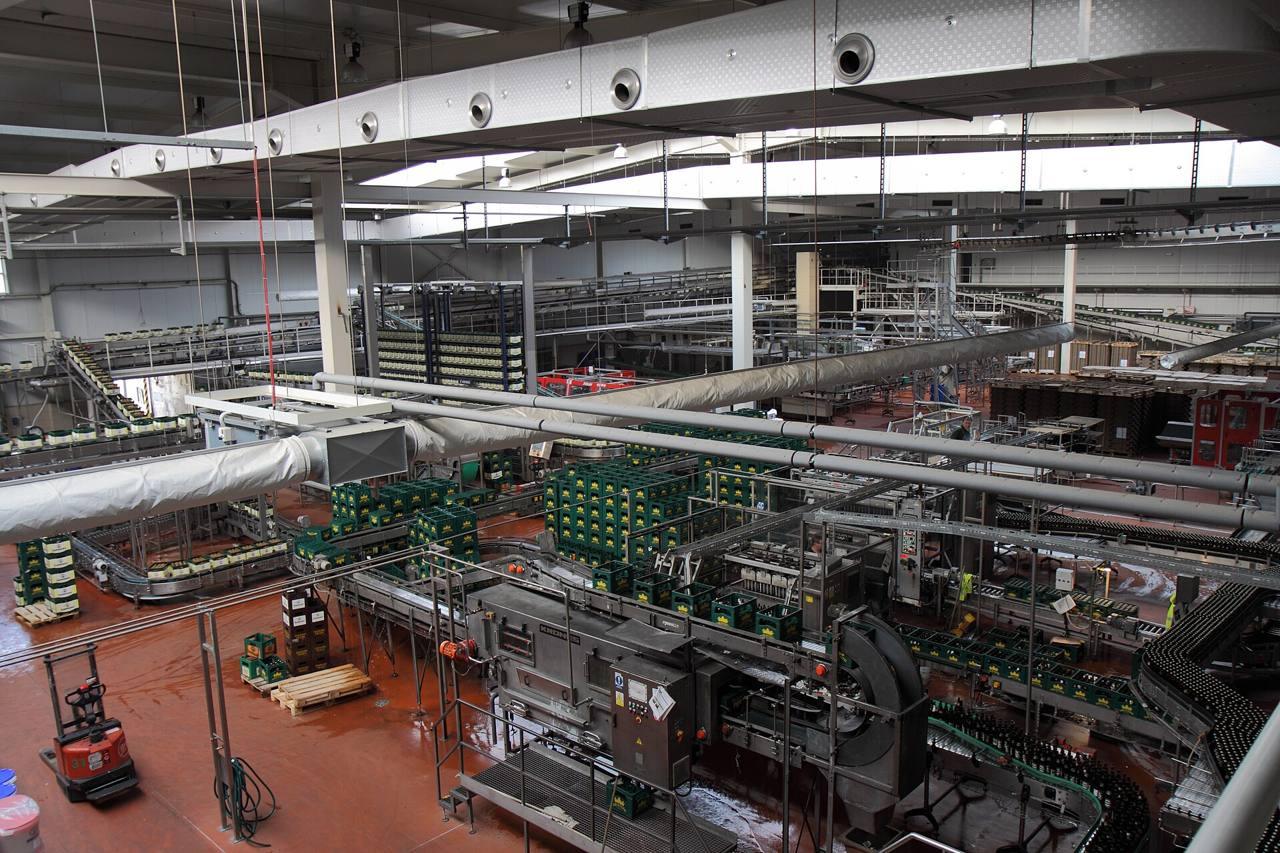
Talk through your use casePhoto: Filling line, Petr Kadlec, CC BY-SA 3.0.